Profile a whole script
When you don't yet know which function is slow, profile everything. With no targeting
flags, profit run instruments every Python and C call in the script and prints them
all, ranked by cumulative time — a map of where the time goes before you zoom in.
examples/basic.py
builds, serializes, and hashes a few thousand records:
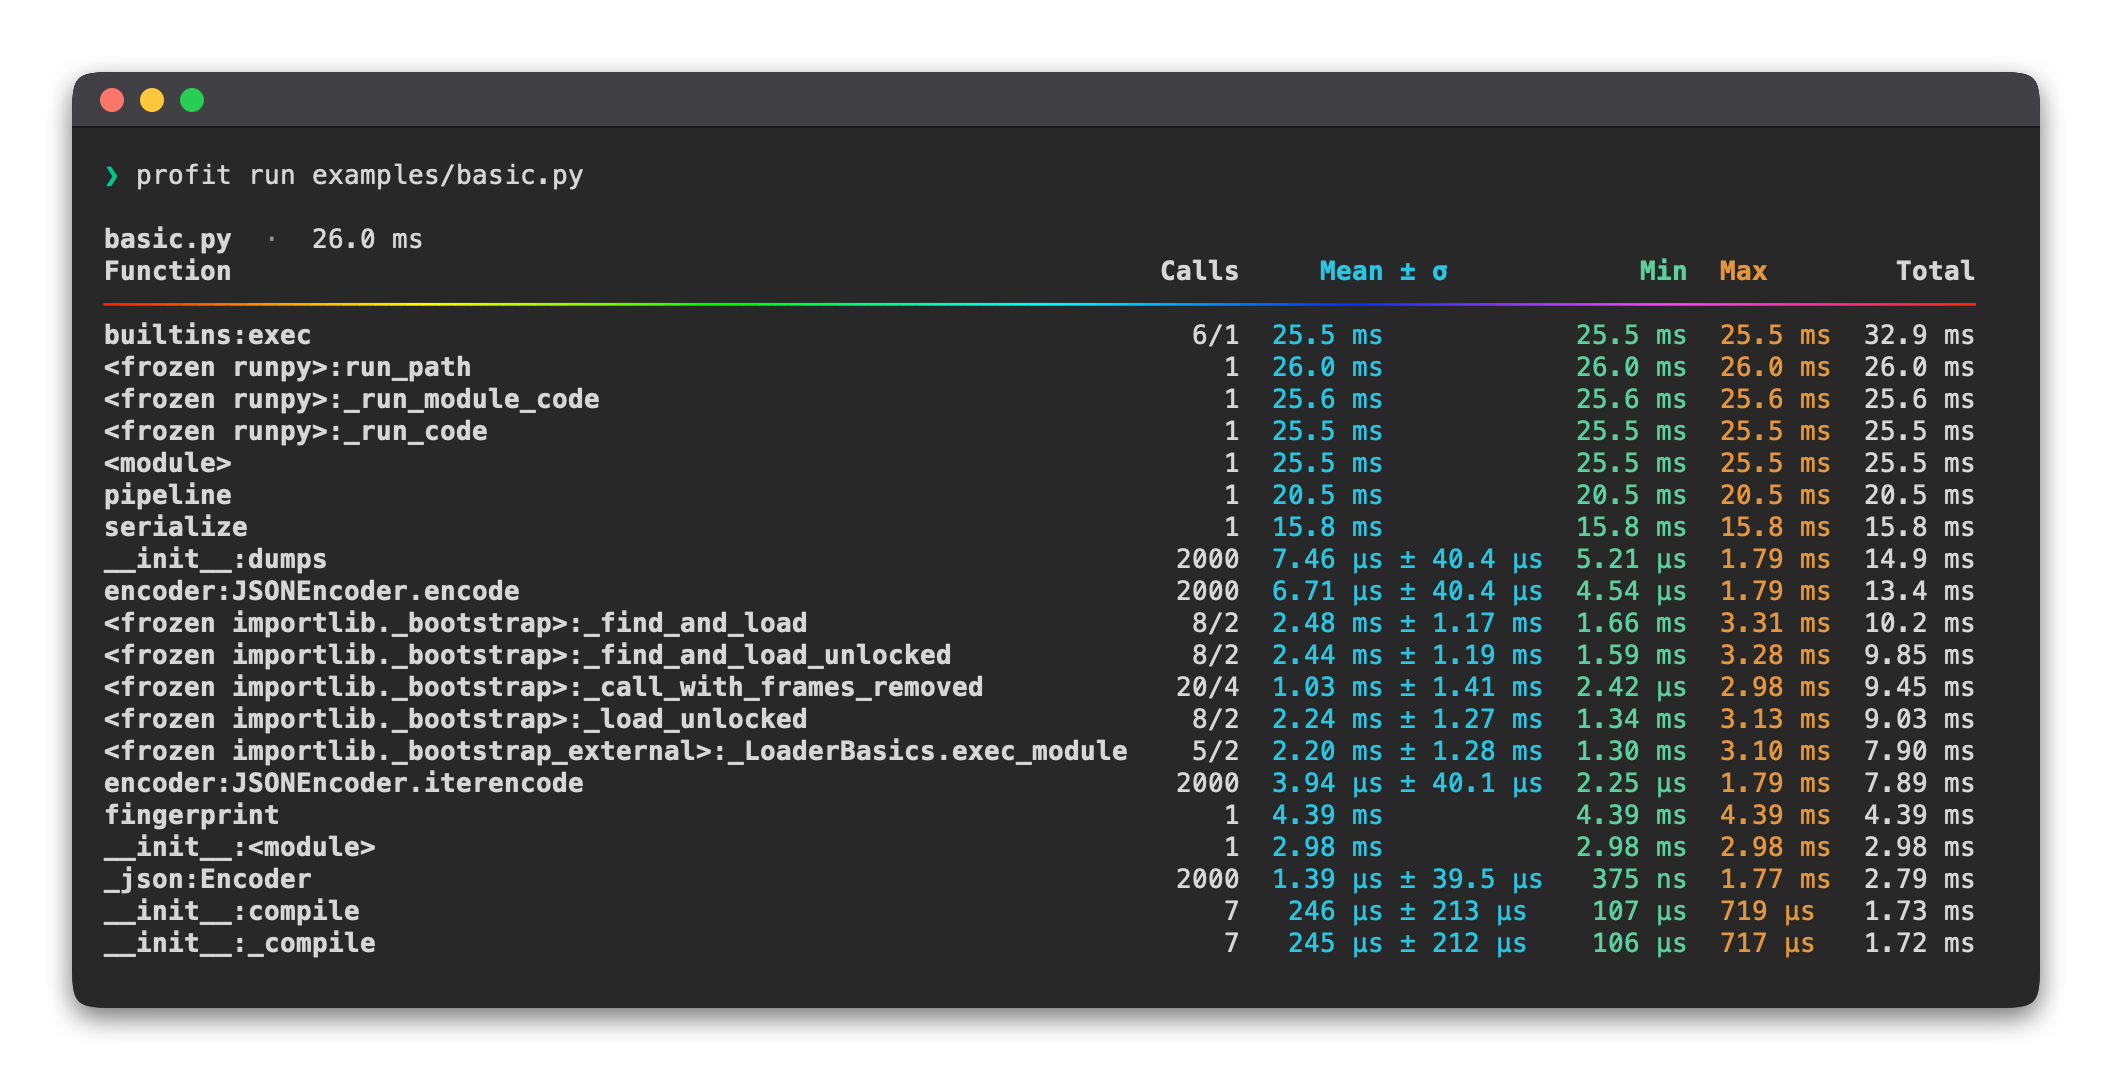
The top rows are usually framework scaffolding — runpy, importlib, exec — because
they sit at the top of the call tree and so accumulate the most time. Scan past them to
your own functions (pipeline, serialize, fingerprint here), find the expensive one,
then switch to -p to focus on it.
Sorting and trimming
--sort chooses the column to rank by and --limit caps the number of rows:
--sort accepts cumulative (the default), tottime, or calls. See the
CLI reference for every flag.
Profile a module
Use -m to profile a module the way python -m would run it:
Next
- Profile a function — once you know where to look.
- Reading the output — the column legend.