profit
Measure the things you care about.
A small, focused Python profiler built on sys.monitoring (Python 3.12+). Name the one
or two functions you want to measure and profit reports their wall-time stats — call
counts, per-call timing, spread — without burying you in a full call-tree dump. Low
overhead, no sampling, no source instrumentation, no config.
Installation
What do you want to do?
-
Profile a function
Measure just the function you care about with
-p. -
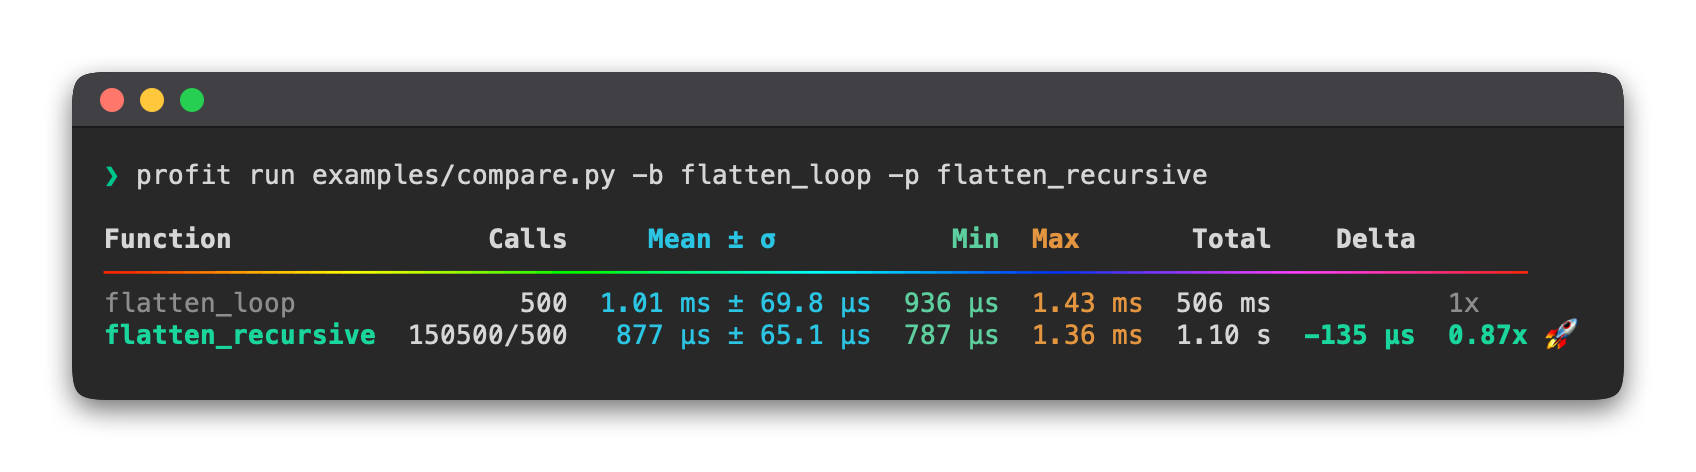
Compare implementations
Put two functions head-to-head and read the delta.
-
Time a statement
Micro-benchmark a single expression,
timeit-style. -
Profile a whole script
No idea where the time goes? Profile everything first.
Prefer to drive it from code? profit also works as a decorator or context manager —
see the Python API. New to the output tables? Start with
Reading the output.
Python 3.12+
profit uses sys.monitoring, which was introduced in Python 3.12. It will not work
on older versions.