Reading the output
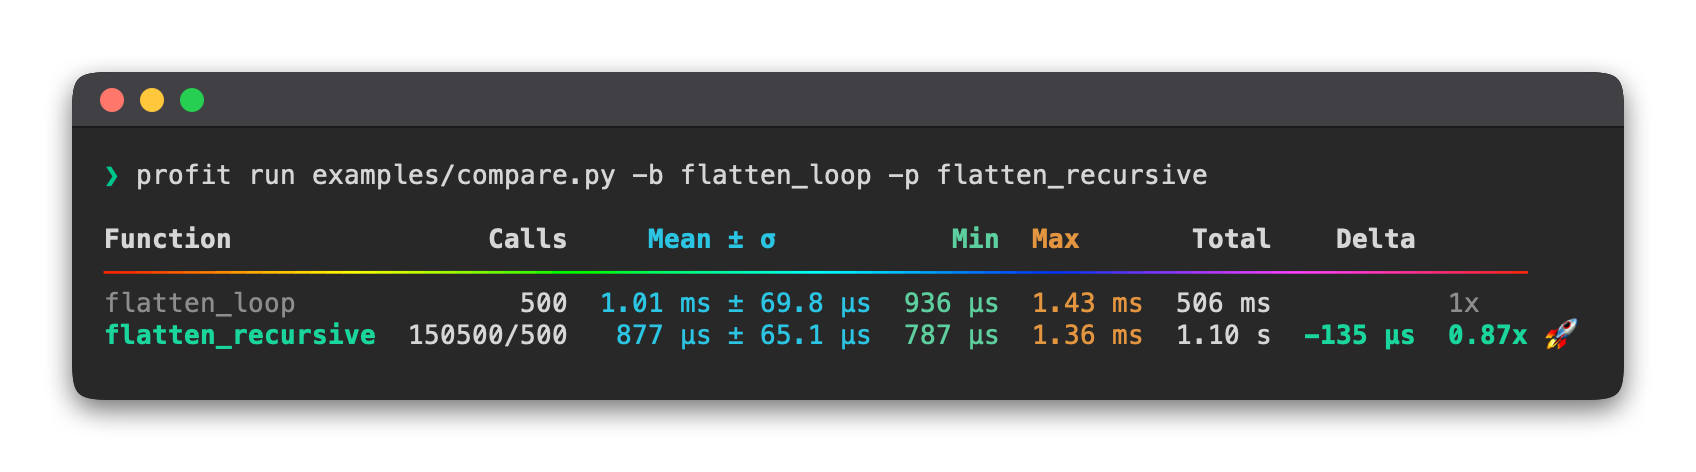
Every profit table shares the same columns. Here's what each one means — the
comparison view below shows them all, including the Delta column that only appears when
you pass a baseline:
| Column | Meaning |
|---|---|
| Function | The function's qualified name. Functions in the profiled script show their bare name; imported code is prefixed with its module (json:dumps). |
| Calls | How many times the function ran. A single number when every call was top-level; total/primitive (e.g. 150500/500) when the function recursed — total calls over non-recursive, outermost calls. |
| Mean ± σ | Average wall time per top-level call, with the standard deviation across those calls. The ± σ is omitted when there was only one call. |
| Min / Max | The fastest and slowest individual top-level call. |
| Total | Cumulative wall time across all calls — the column the default cumulative sort ranks by. |
| Delta | Only in comparison mode: the mean-per-call difference from the baseline, plus a ratio (0.87x ≈ 13% faster). The baseline row reads 1x. |
Wall time, measured per top-level call
profit measures wall-clock time (via sys.monitoring and perf_counter_ns), not
CPU time — so time spent sleeping or waiting on I/O is included. Timing is recorded per
top-level call: when a function calls itself, the recursion is folded into the
outermost call's time rather than counted per frame. That's why Calls distinguishes
total from primitive calls, and why Min / Max / Mean are taken over the primitive
ones.
What's left out
profit hides its own machinery — the profiler's frames and the sys.monitoring
callbacks never appear in the table — so the numbers reflect your code, not the cost of
measuring it.