Profile a function
The core of profit: pick the function you care about and measure only it. Pass its
name with -p (--profile) and the output collapses to a single row — call count,
mean time per call, spread, and total — with none of the surrounding call-tree noise.
Try it on examples/focus.py,
which calls tokenize() fifty times inside a larger script:
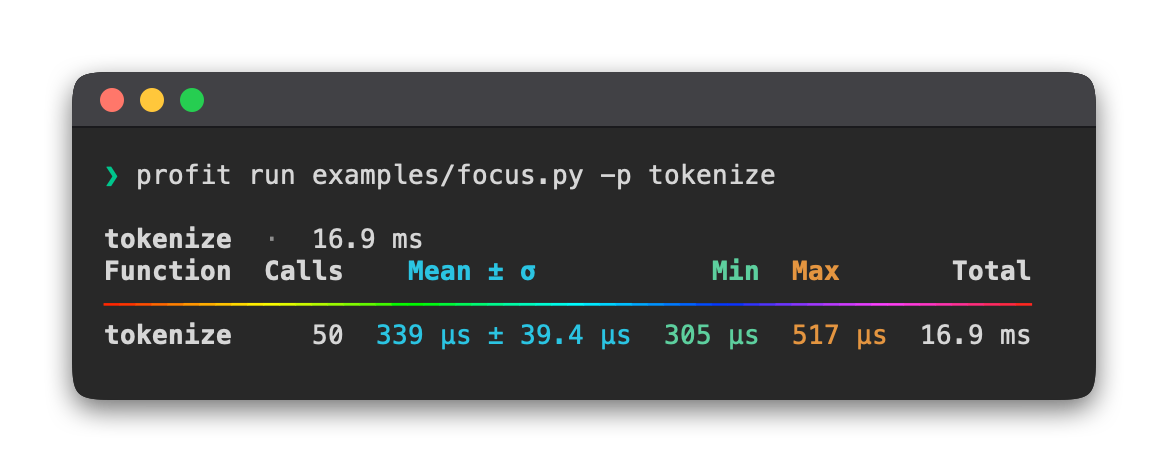
One row, the one you asked for: tokenize ran 50 times, and the timing columns show how
long each call took. See Reading the output for what every column means.
Naming the function
-p accepts a few target formats:
| Format | Example | Resolves to |
|---|---|---|
| bare name | tokenize |
matched by function name after the script runs |
module:name |
mymod:helper |
helper in mymod |
module:Class.method |
mymod:Parser.run |
the method on that class |
For a script you run directly, a bare name is easiest — profit matches it by name
once the script has finished, so the function doesn't need to be importable up front. For
code in an installed package, use module:name. Full details in the
CLI reference.
Profile several functions at once
Repeat -p to line up multiple functions in the same table:
Next
- Compare implementations — measure two functions side by side.
- Reading the output — the column legend.